Value Insights
FreeA health check for any US-listed company. See its growth, profits, cash flow, debt, and valuation, each rated Strong, Moderate, or Weak with a short reason why, over up to five years.
See how a company is doing, whether its stock looks cheap or expensive, and what its latest earnings said, with every number explained.
Built for everyday investors
Nvidia keeps about 66 cents of every revenue dollar as operating profit — nearly four times the index median.Nvidia keeps about 66 cents of every revenue dollar as operating profit — nearly four times the S&P 500 median. Margins that wide usually mean pricing power; the open question is durability, not quality.
Erasbridge is AI and can make mistakes. Not financial advice.
What you can do
A health check for any US-listed company. See its growth, profits, cash flow, debt, and valuation, each rated Strong, Moderate, or Weak with a short reason why, over up to five years.
Ask anything about stocks in your own words. Compare companies, find stocks that fit what you're looking for, or ask what a company just reported. Answers come back as charts and tables with the numbers shown.
See who reports this week, what just came out, and how the season is going. On Plus, you also get an email when a stock on your watchlist reports, plus a written summary of the release in a casual or analyst style.
Don't understand a number? Ask about it, and keep asking until it makes sense.
Answers come from company financial reports and market prices.
Each number comes with what it means and why it matters.
If we can't confirm a number, we don't show it.
See it in action
Compare two companies, find the most profitable stocks in the S&P 500, line up a few side by side, or check whether a price looks high against its own history. Erasbridge picks the chart and shows the numbers behind it.
Erasbridge is AI and can make mistakes. Not financial advice.
Numbers you can trust
When a company reports earnings, Erasbridge reads the filing within minutes and checks every figure against the page it’s printed on before you see it.
Each figure has to be on the exact line of the report it came from. Our AI points to it; it never gets to supply a number.
A figure is shown only when the report itself proves which period it covers, so last year’s number never passes for this year’s.
If a figure can’t be confirmed, we leave it blank. A gap is better than a wrong number.
We keep a copy of the exact filing behind every number, so each one can be traced back to the report it came from.
How it works
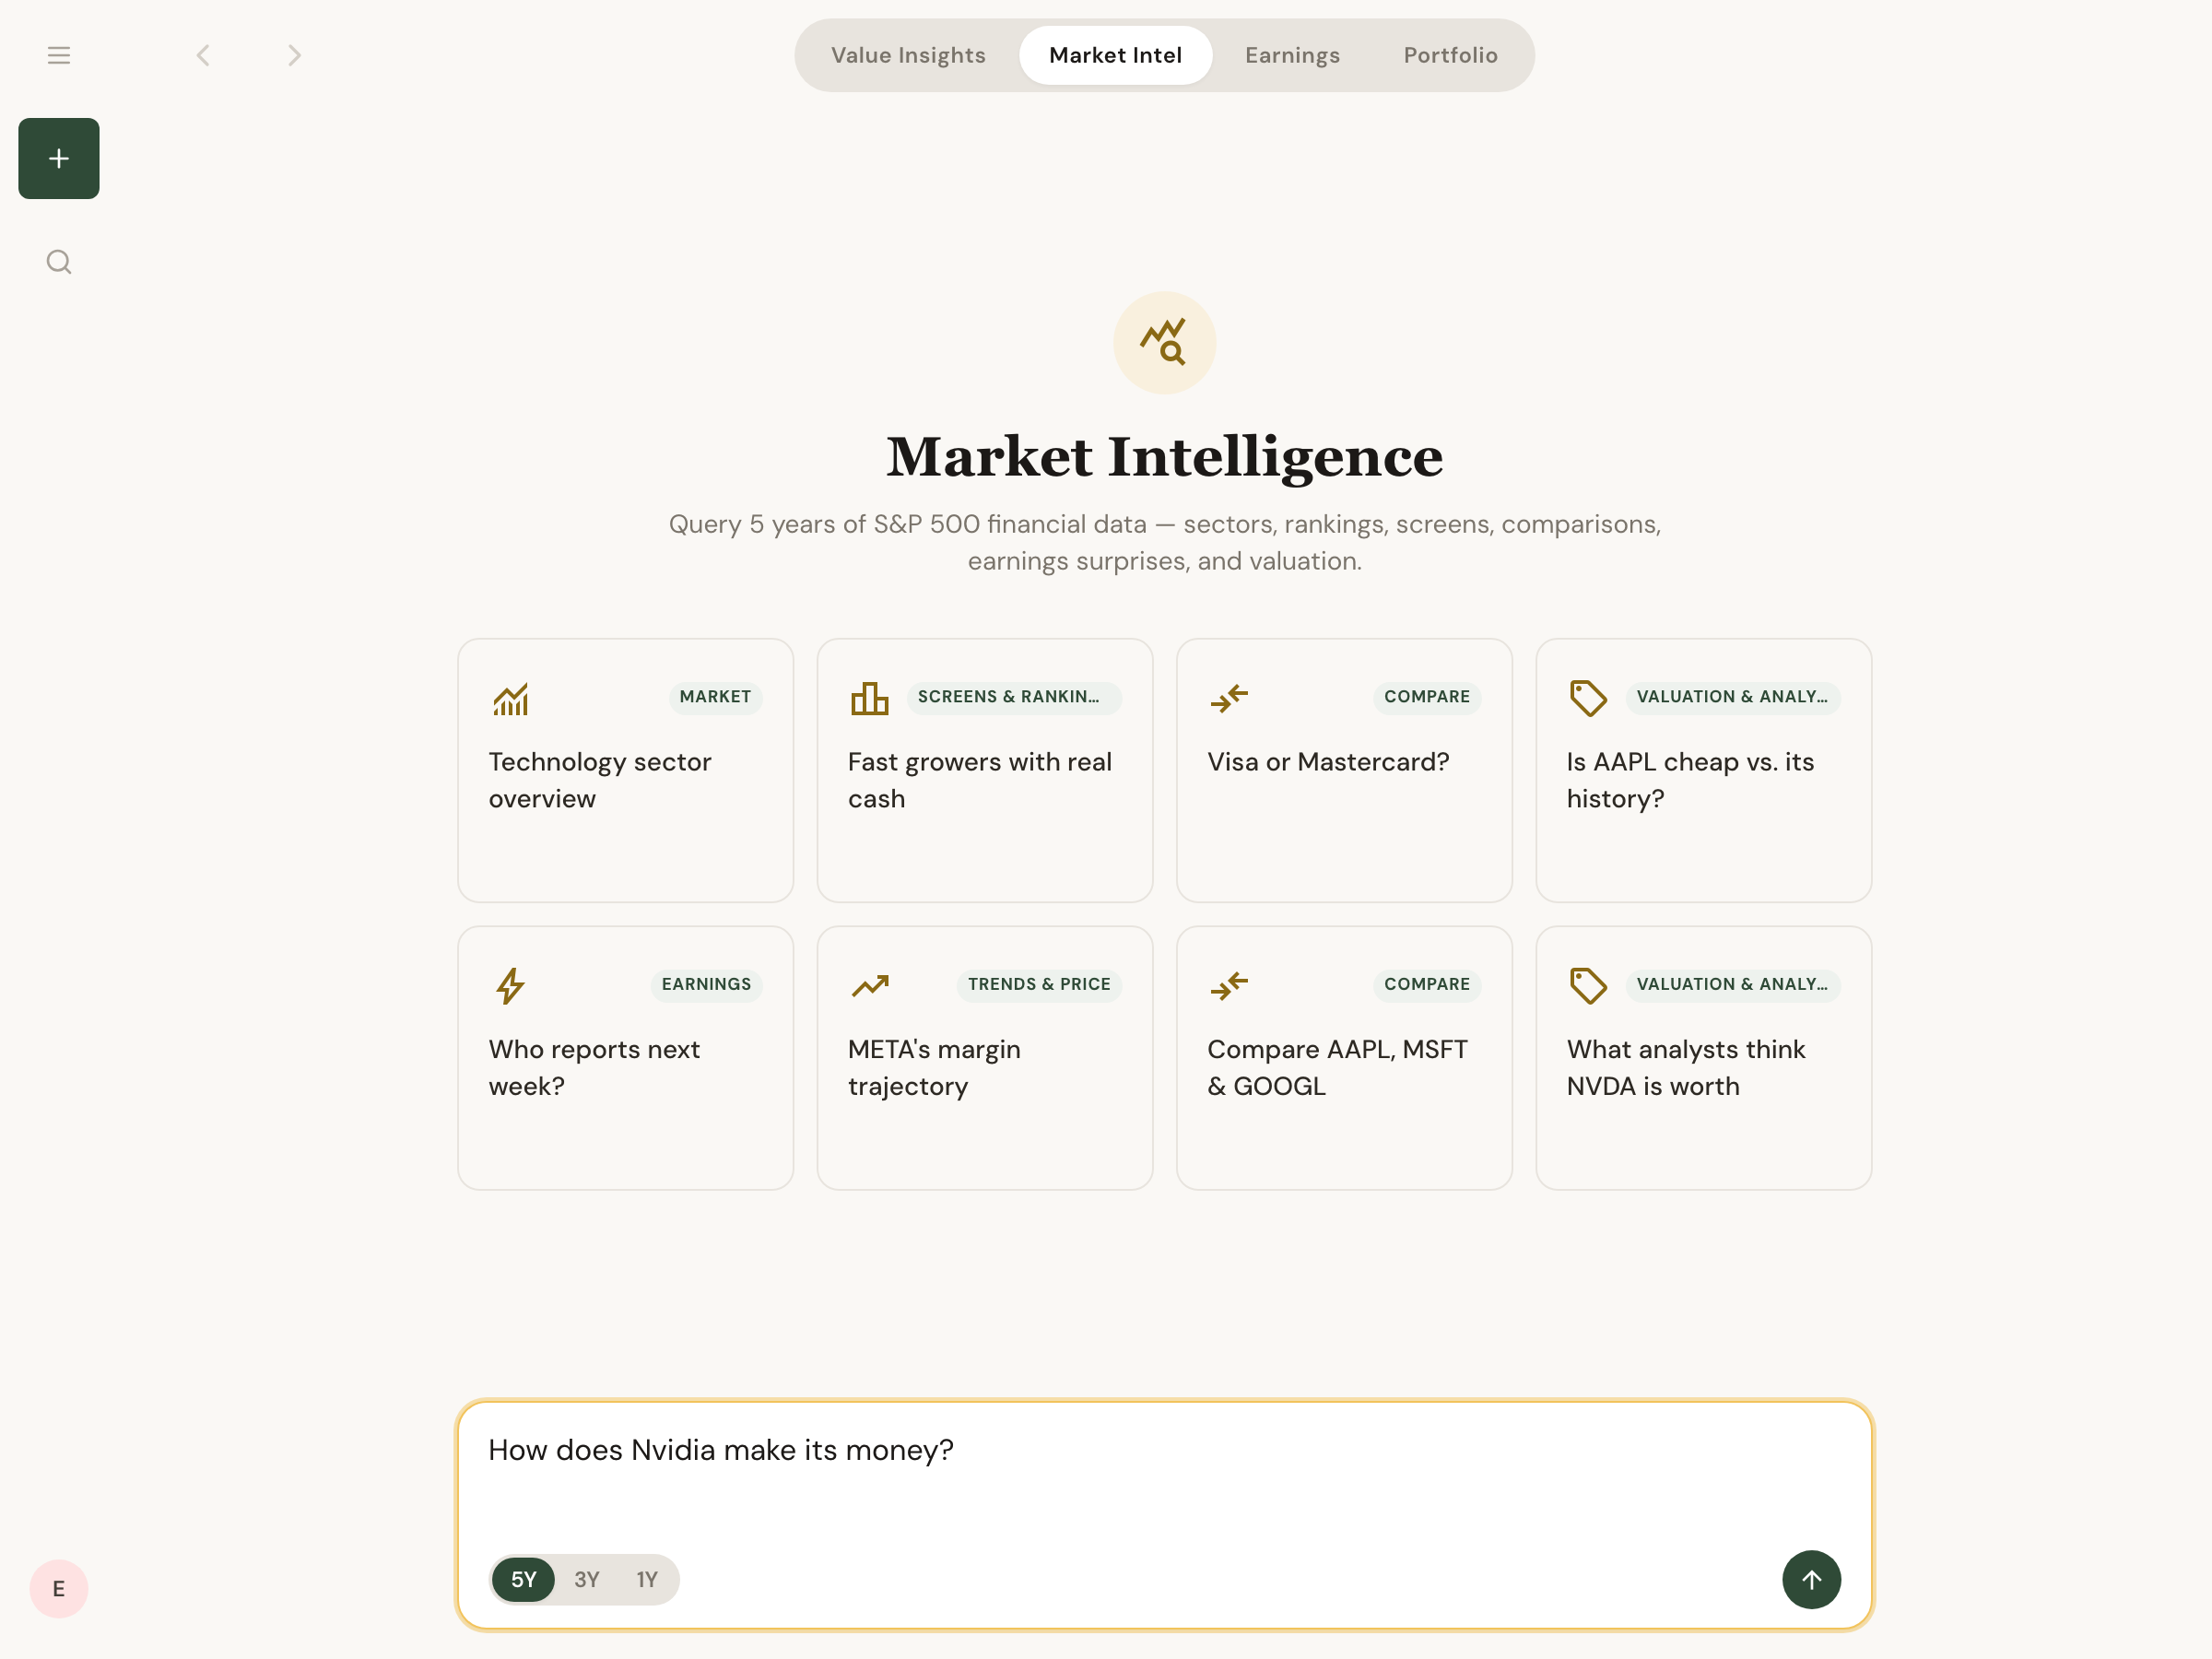
Type a company name, a ticker, or any question about the market, the way you'd say it out loud.
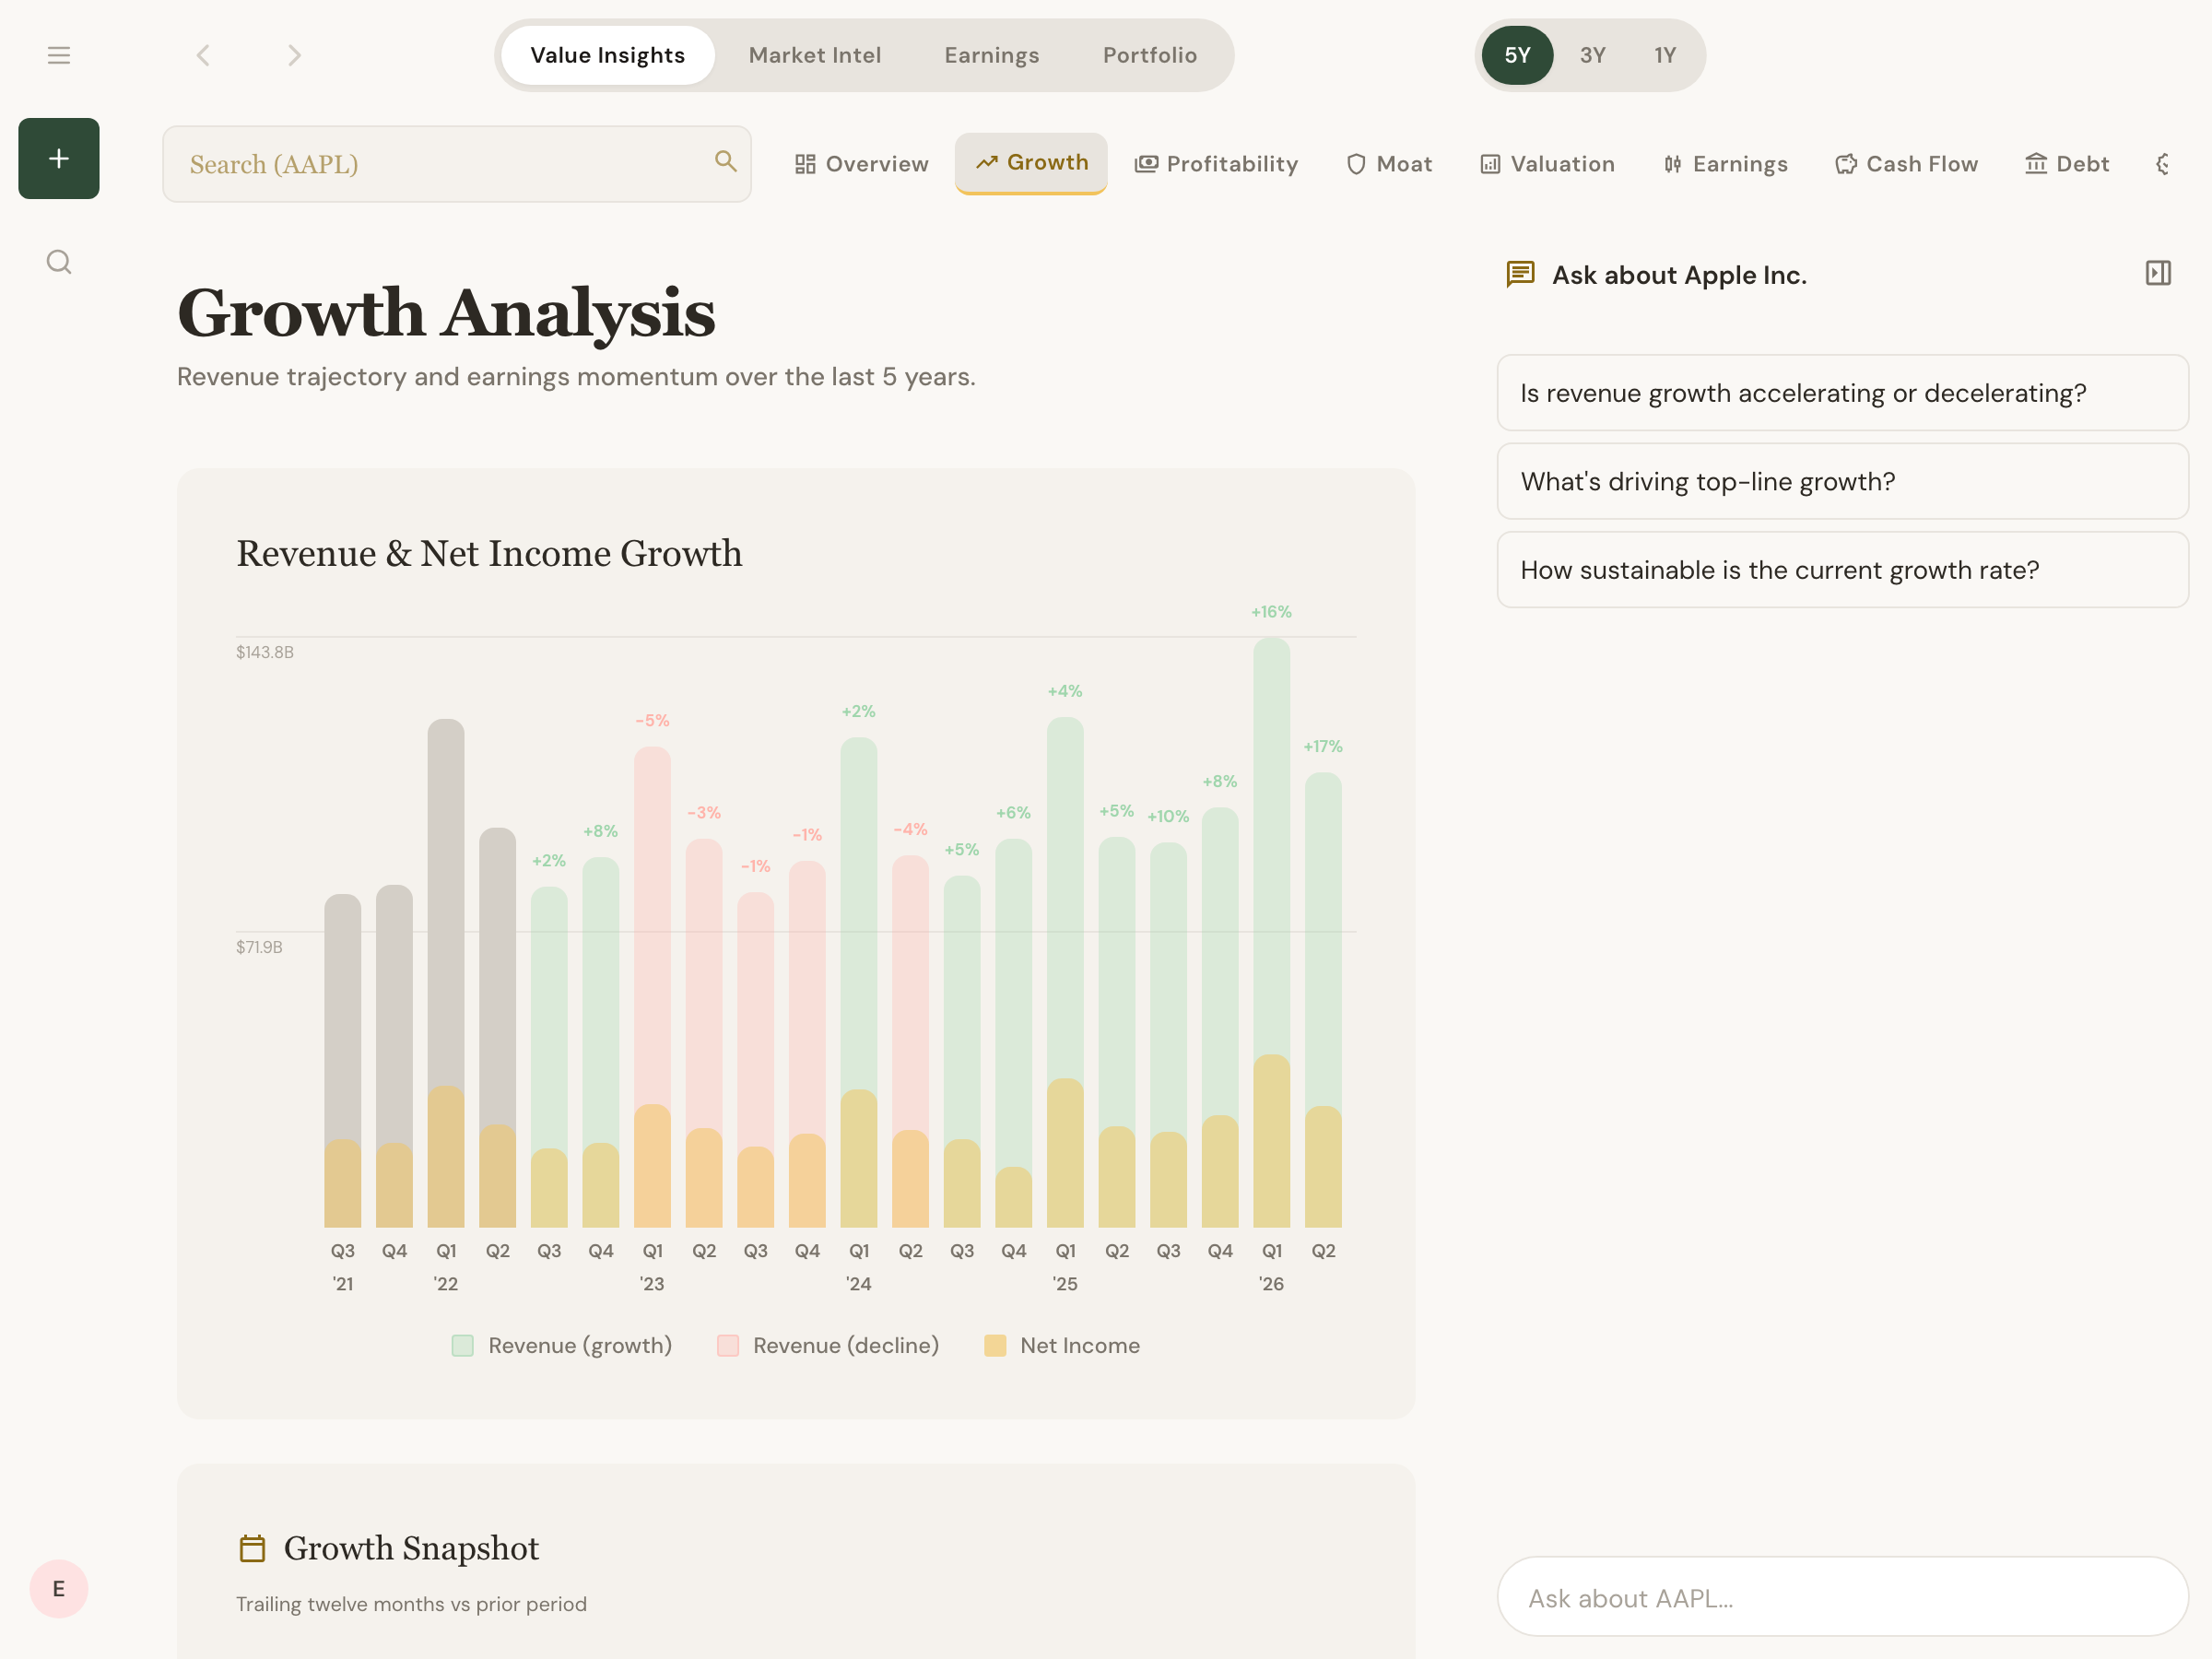
Erasbridge pulls the company's actual financials and works through the numbers like an analyst would.
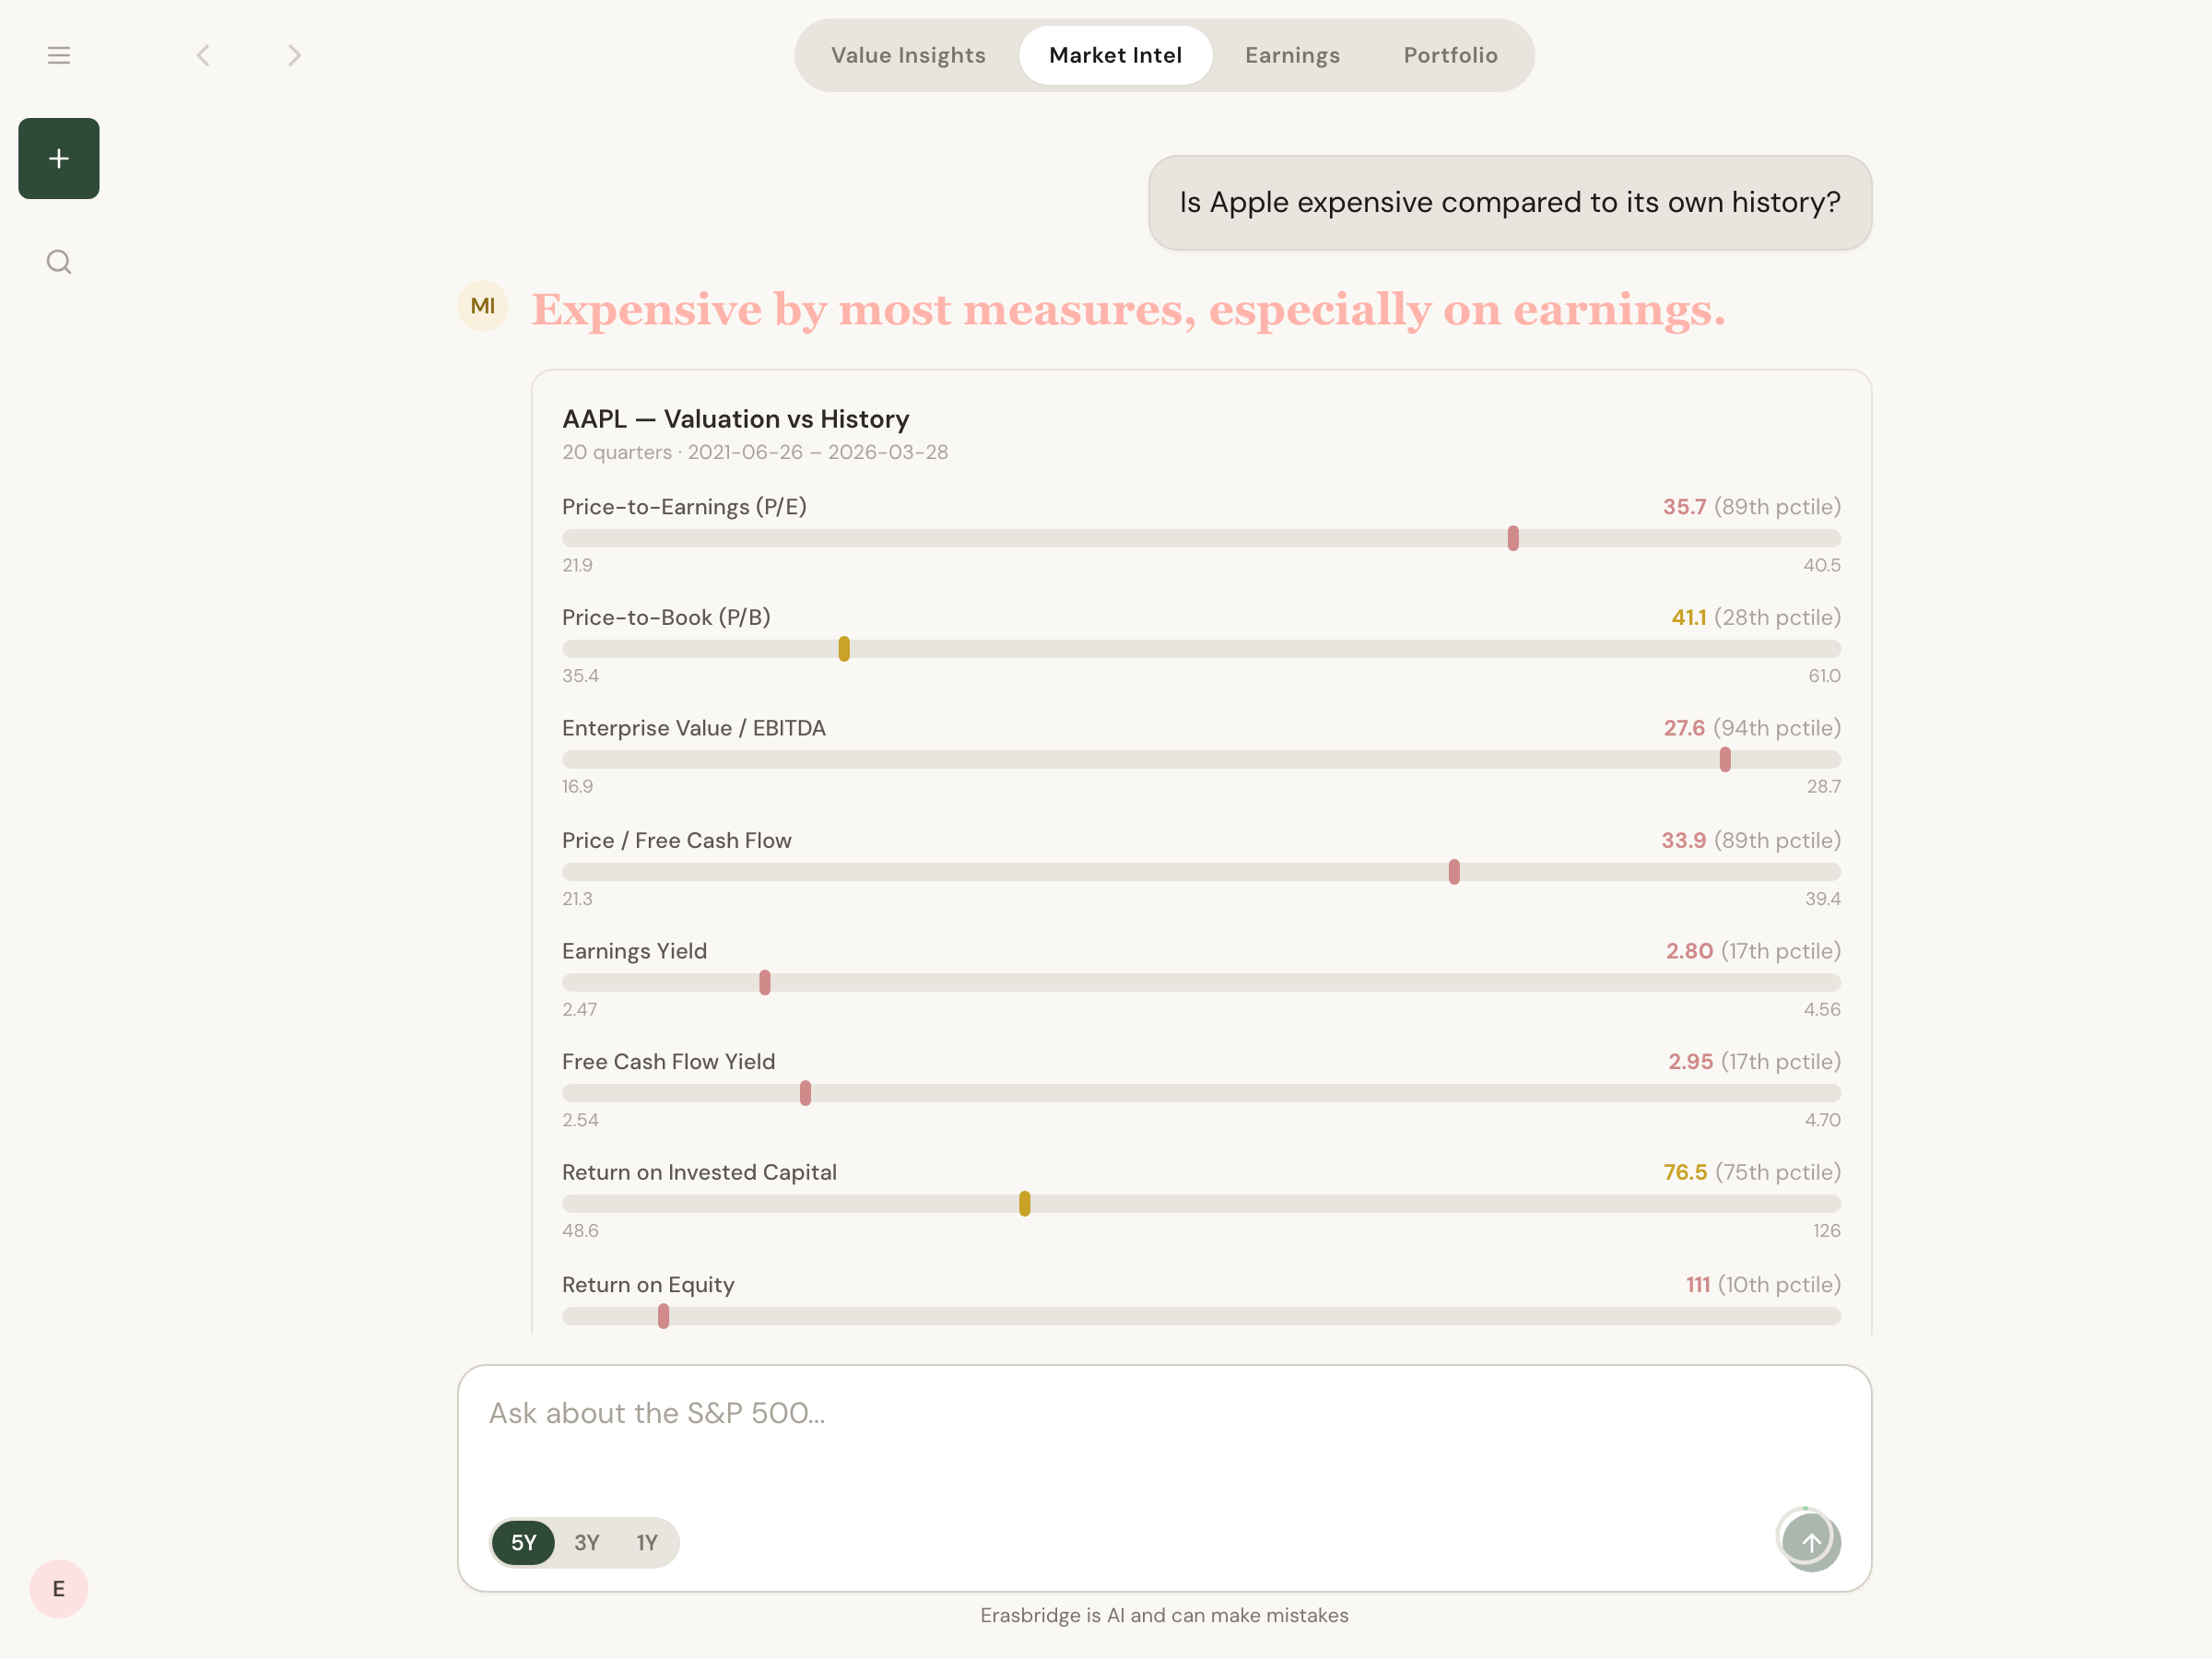
You get a clear answer with the numbers behind it. Ask follow-ups until it clicks; the decision stays yours.
Pricing
$0/ month
Everything you need to start understanding the market.
$10/ month
For investors who follow earnings closely and want deeper answers.
Upgrade or cancel anytime from your account settings.
FAQ
Yes, to start. Company health checks, market questions, and the earnings calendar are free, with a monthly usage allowance. Plus is $10 a month and adds our most capable AI, written earnings summaries, email alerts when stocks on your watchlist report, and more usage.
With your Google account. There's nothing to install; Erasbridge runs in your browser.
Any US-listed stock.
From companies' own financial reports and market prices. If we can't confirm a number, we don't show it.
No. Erasbridge explains how a company is doing and what its numbers mean. It doesn't tell you what to buy or sell; the decision stays yours.
Yes. Upgrade or cancel anytime from your account settings.
It can, like any AI. That's why every answer shows the numbers behind it, and you can ask follow-ups to check them.
